
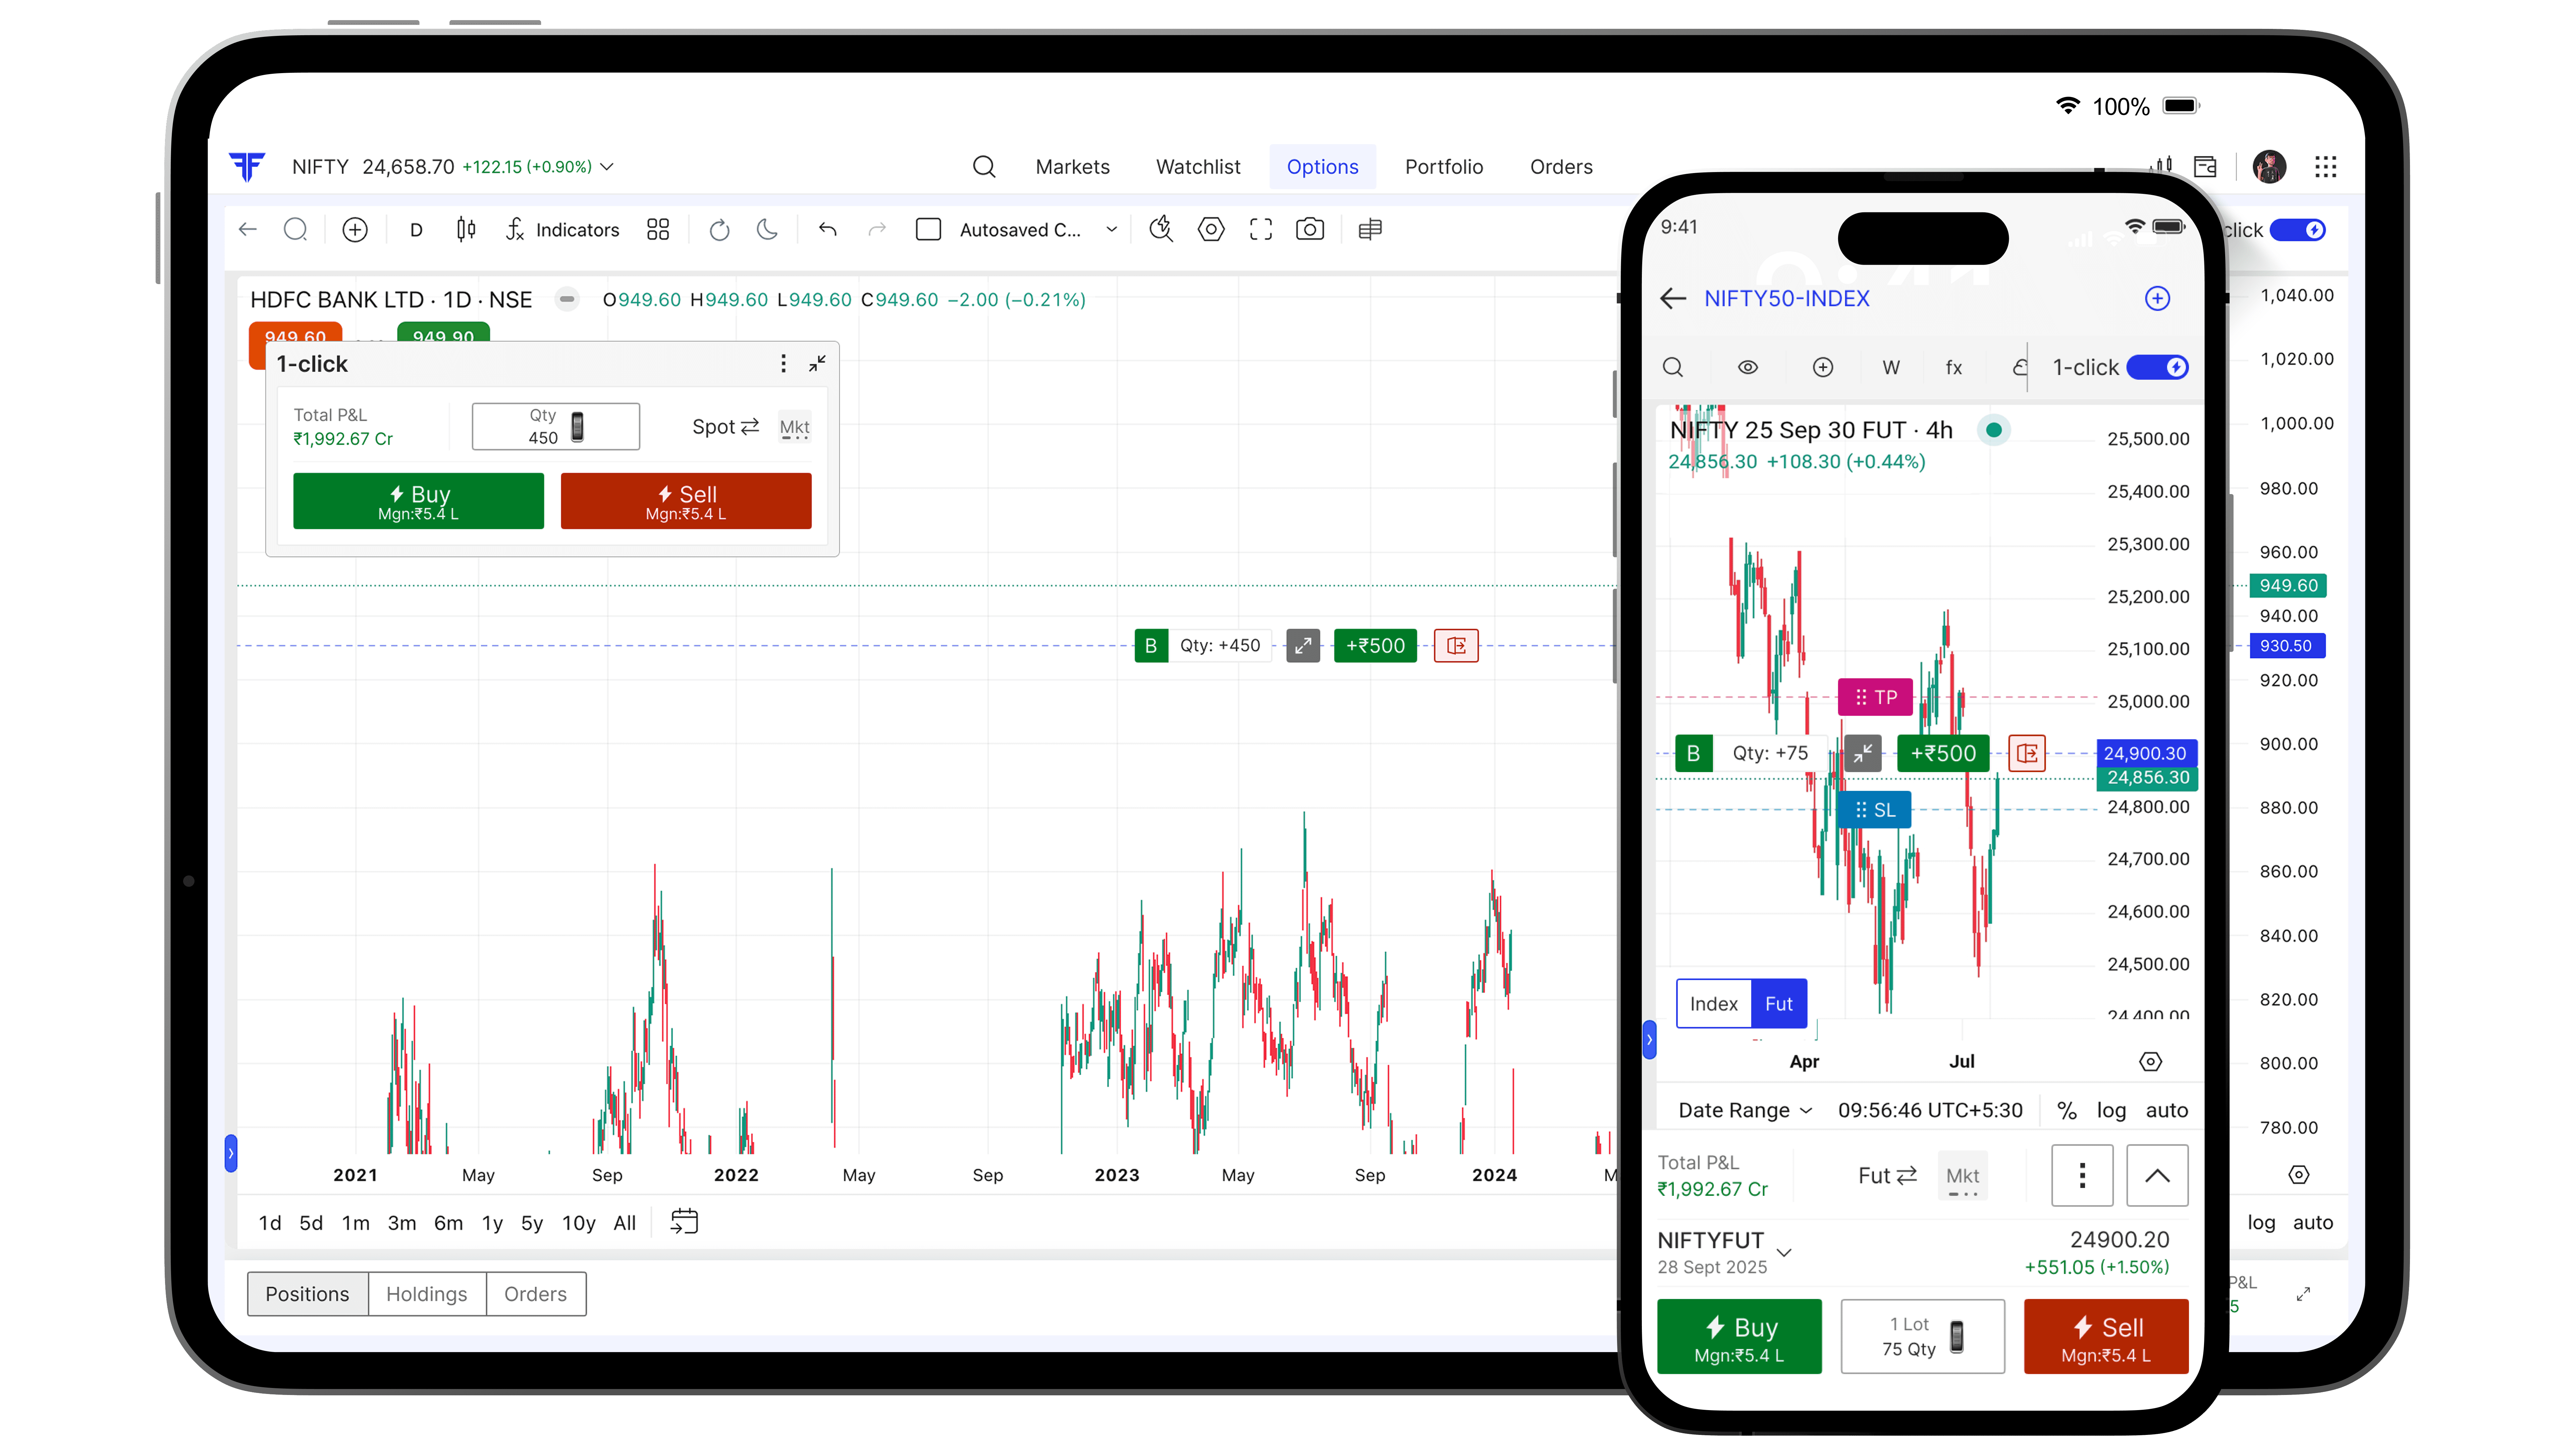
Trade spot, futures, and options seamlessly from charts—simplifying workflows and boosting efficiency and revenue.
Trade spot, futures, and options seamlessly from charts—simplifying workflows and boosting efficiency and revenue.
Trade spot, futures, and options seamlessly from charts—simplifying workflows and boosting efficiency and revenue.
[ Charting the Future ]
[ Charting the Future ]
Designing Speed into Every Trade
Designing Speed into Every Trade
When markets move fast, seconds matter. Yet, most traders still juggle between their charting tool and order window — losing context, focus, and sometimes opportunity.
That friction became the seed for this project — a new way to trade directly from charts, without ever leaving the market view.
When markets move fast, seconds matter. Yet, most traders still juggle between their charting tool and order window — losing context, focus, and sometimes opportunity.
That friction became the seed for this project — a new way to trade directly from charts, without ever leaving the market view.
[ Where it all Began ]
[ Where it all Began ]
Started with one quick move
Started with one quick move
This was a one-month sprint — and I was the sole UX designer, responsible for everything from research to the final prototype.
The idea came up during a strategy discussion with the CPO: “What if traders could act instantly on what they see — right from the chart itself?”
This was a one-month sprint — and I was the sole UX designer, responsible for everything from research to the final prototype.
The idea came up during a strategy discussion with the CPO: “What if traders could act instantly on what they see — right from the chart itself?”
[ Reading trader patterns ]
[ Reading trader patterns ]
Finding the rhythm of a trader’s mind
Finding the rhythm of a trader’s mind
Before diving into design, I needed to understand how traders think when markets are live.
I spoke to five active traders and observed how they interacted with charts during real-time market hours.
Their reactions were clear and consistent:
• They hated switching tabs during volatility.
• They relied heavily on visual cues and quick access.
• They wanted control — but not clutter.
A simple insight emerged:
Before diving into design, I needed to understand how traders think when markets are live.
I spoke to five active traders and observed how they interacted with charts during real-time market hours.
Their reactions were clear and consistent:
• They hated switching tabs during volatility.
• They relied heavily on visual cues and quick access.
• They wanted control — but not clutter.
A simple insight emerged:

So, I built a user persona representing an active trader who juggles spot, futures, and options simultaneously — impatient with clutter but obsessed with control. Every design choice later tied back to this person’s need for speed, visibility, and confidence.
So, I built a user persona representing an active trader who juggles spot, futures, and options simultaneously — impatient with clutter but obsessed with control. Every design choice later tied back to this person’s need for speed, visibility, and confidence.

[ Visualizing the impossible ]
[ Visualizing the impossible ]
Sketching what didn’t exist
Sketching what didn’t exist
I began exploring how trade execution and chart interaction could coexist without fighting for space.
Early sketches looked chaotic — order window, positions on charts.
It was easy to overwhelm the interface. So I stripped it back. The design had to breathe.
After a few iterations, a pattern started forming — a footer-first approach.
Placing all trading actions in a footer panel kept the chart visible, yet gave traders instant access to buy/sell controls.
That balance — visibility and velocity — became the design’s foundation.
I began exploring how trade execution and chart interaction could coexist without fighting for space.
Early sketches looked chaotic — order window, positions on charts.
It was easy to overwhelm the interface. So I stripped it back. The design had to breathe.
After a few iterations, a pattern started forming — a footer-first approach.
Placing all trading actions in a footer panel kept the chart visible, yet gave traders instant access to buy/sell controls.
That balance — visibility and velocity — became the design’s foundation.
[ Clear design from chaos ]
[ Clear design from chaos ]
Building clarity out of complexity
Building clarity out of complexity
To make this work, I restructured the interface architecture.
Charts took the central stage — occupying nearly 60% of the screen at all times.
The rest of the elements: order book, open positions, and trade inputs — tucked neatly below or to the side as bottomsheets.
Every pixel served one principle: “The chart should never disappear.”
We already had a design library in place, ensuring visual consistency across the platform.
My focus was on refining trading interactions and clarity within the chart workspace — color-coded actions that kept the experience fast, focused, and trader-first.
To make this work, I restructured the interface architecture.
Charts took the central stage — occupying nearly 60% of the screen at all times.
The rest of the elements: order book, open positions, and trade inputs — tucked neatly below or to the side as bottomsheets.
Every pixel served one principle: “The chart should never disappear.”
We already had a design library in place, ensuring visual consistency across the platform.
My focus was on refining trading interactions and clarity within the chart workspace — color-coded actions that kept the experience fast, focused, and trader-first.
[ Viewpoint ]
[ Viewpoint ]
Seeing through their lens
Seeing through their lens
To go deeper, I mapped emotions and actions through an empathy map.
What do traders see during market swings? What do they hear from peers? What do they feel when the interface slows them down?
This helped reveal one truth — every extra click feels like a missed opportunity. That realization became the emotional anchor for every wireframe and design iteration that followed.
To go deeper, I mapped emotions and actions through an empathy map.
What do traders see during market swings? What do they hear from peers? What do they feel when the interface slows them down?
This helped reveal one truth — every extra click feels like a missed opportunity. That realization became the emotional anchor for every wireframe and design iteration that followed.

[ Designs come alive ]
[ Designs come alive ]
Turning feedback into finesse
Turning feedback into finesse
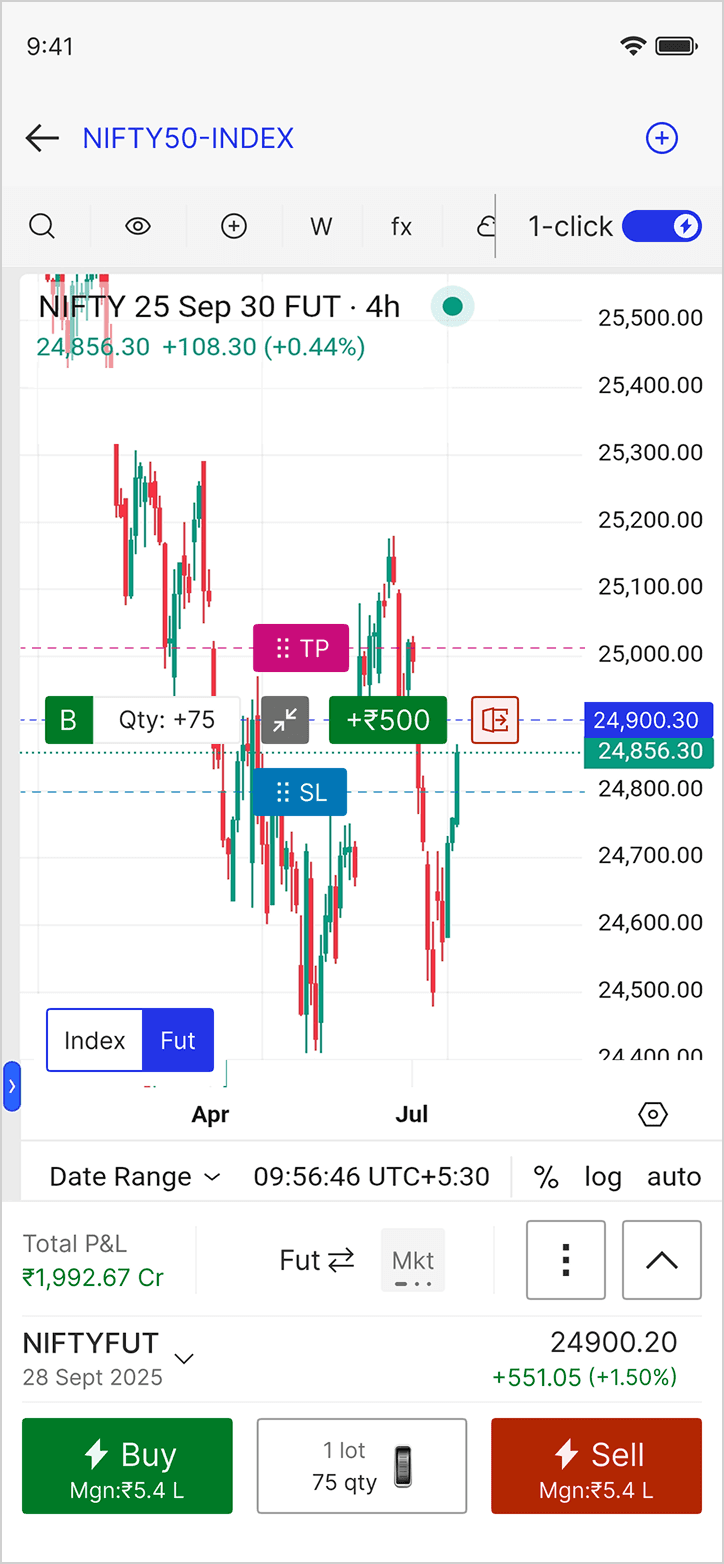
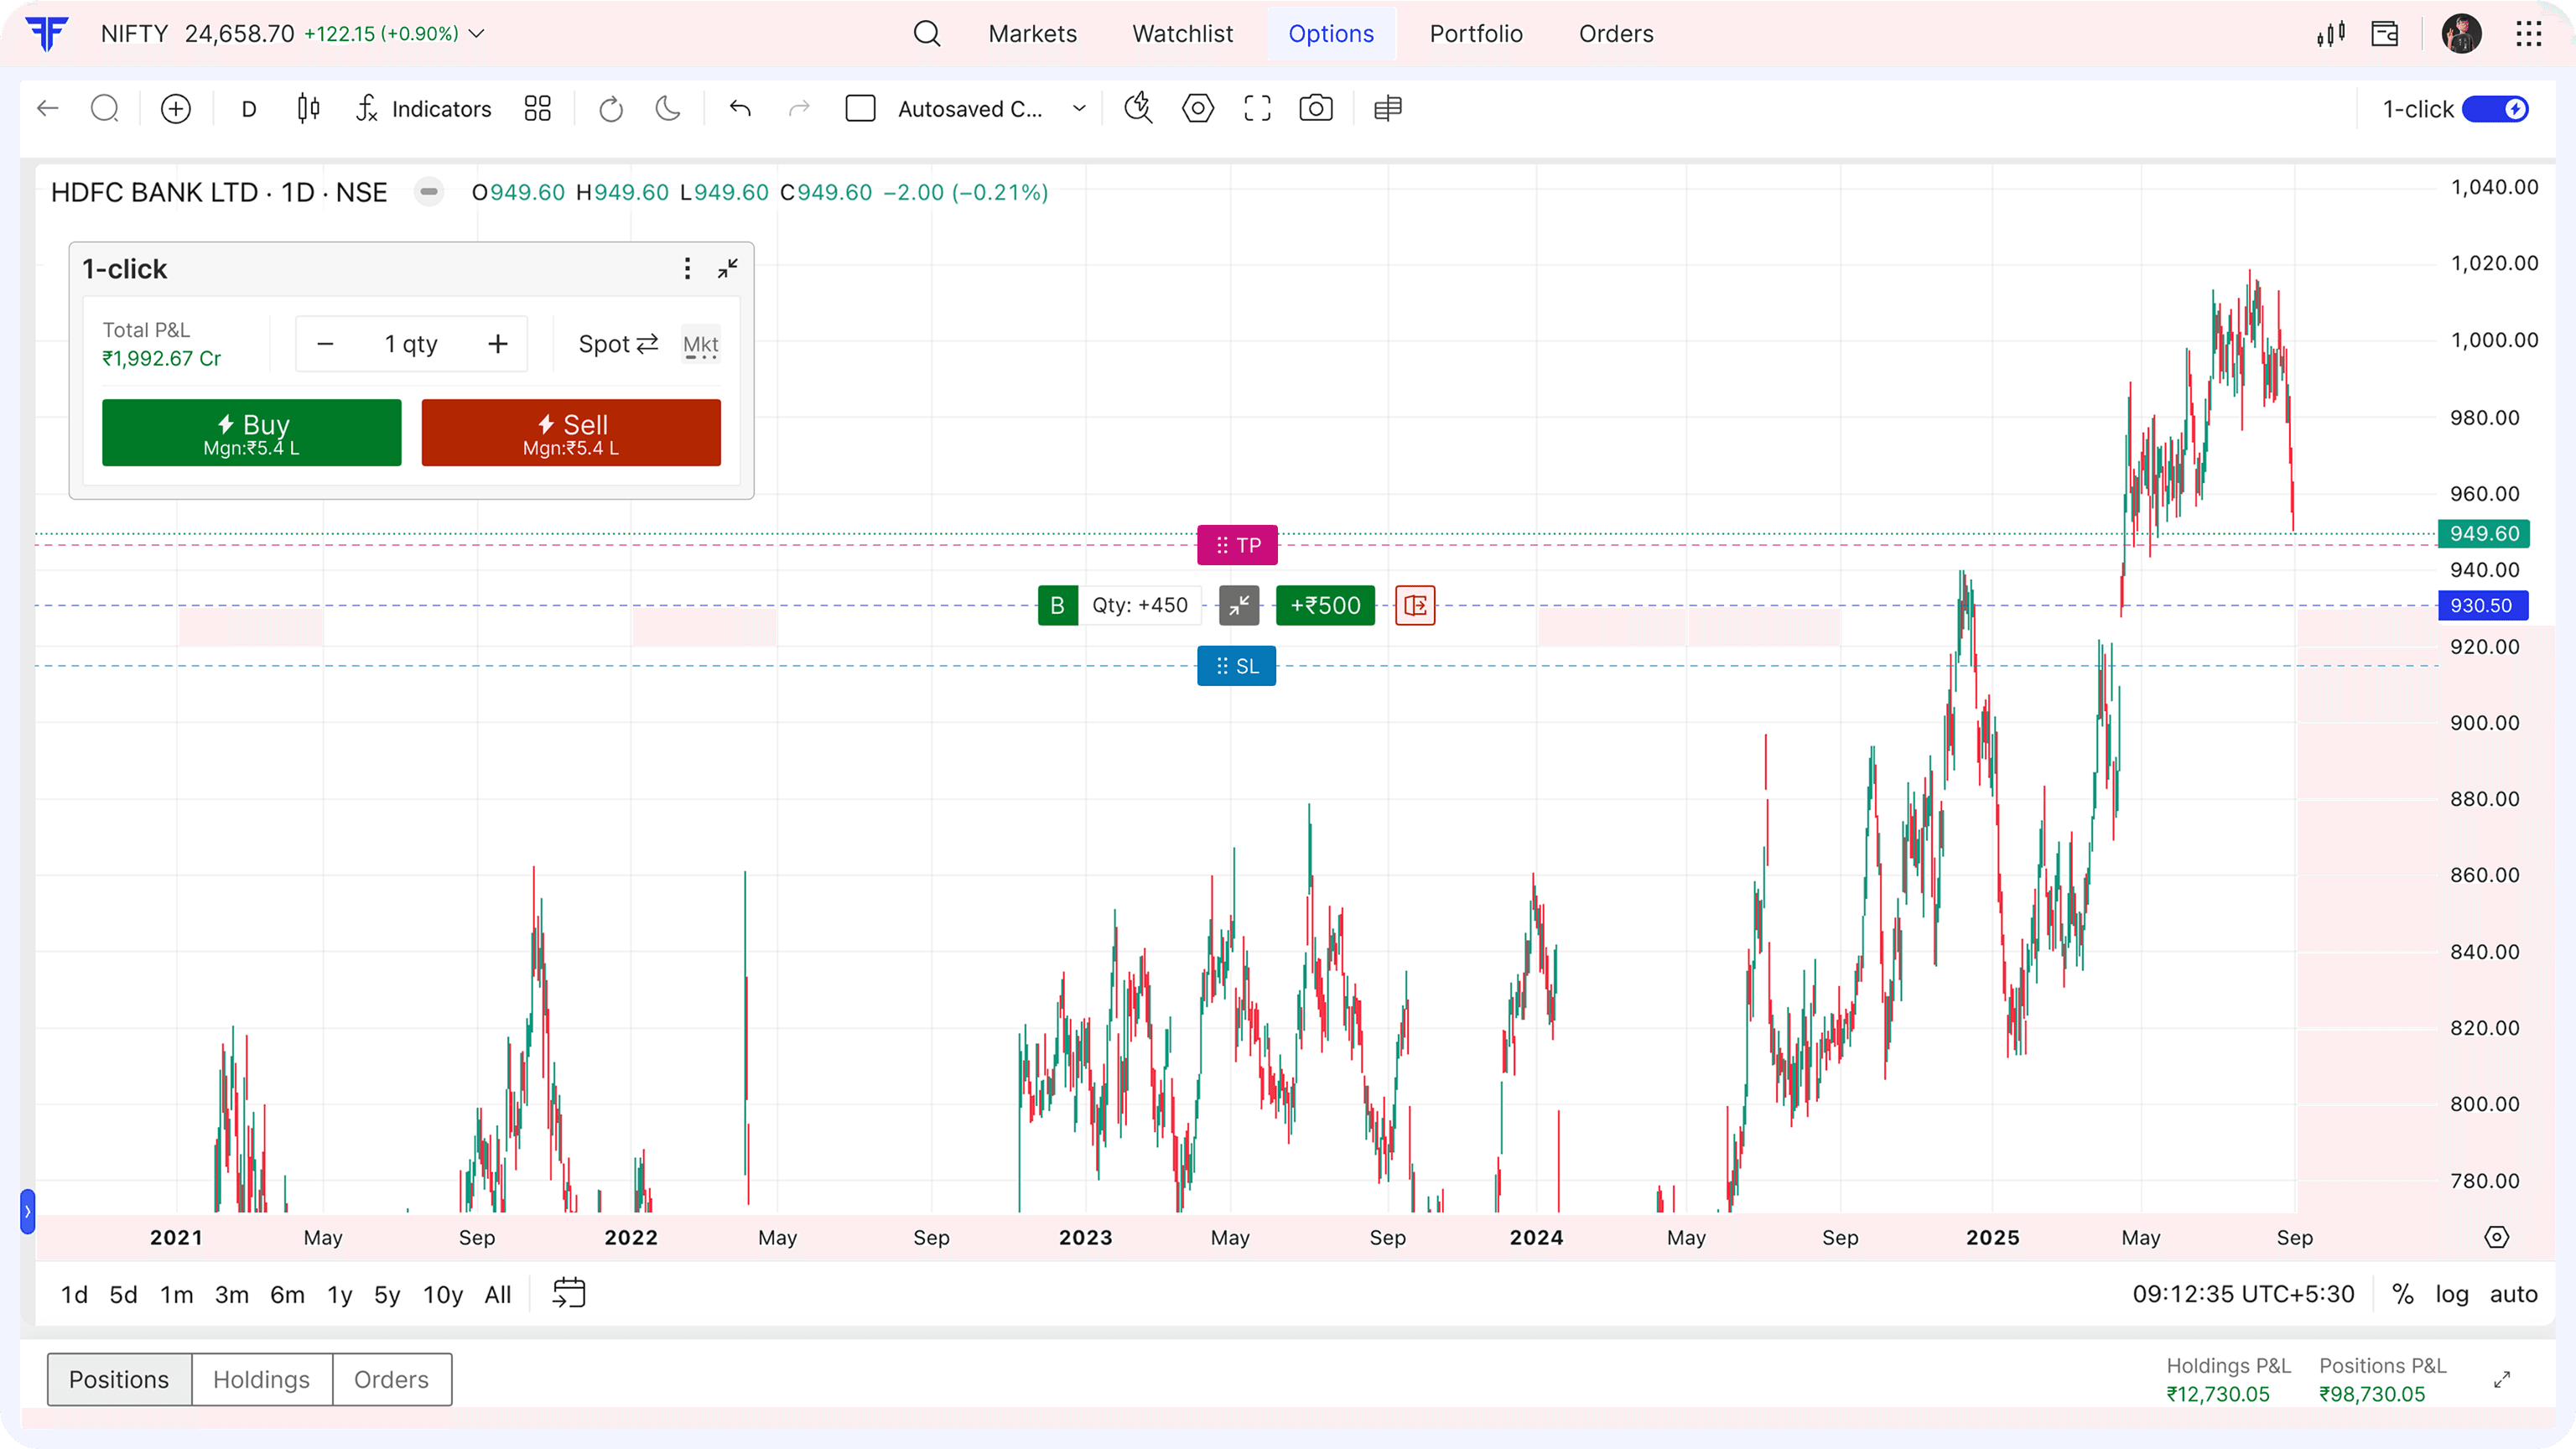
A quick glimpse of the high-fidelity screens showcasing key features.
A quick glimpse of the high-fidelity screens showcasing key features.




[ Tested. Refined. Ready. ]
Hearing it from the pros
Once the prototype was ready, we tested it internally with professional traders who trade daily — the ones for whom every second counts. Their reactions were immediate and enthusiastic: they could place trades, adjust positions, and monitor charts without losing focus, all in one view.
Feedback like “This feels like trading on autopilot, but with full control” reinforced that our approach wasn’t just functional — it was transformative for their workflow. This internal validation gave us confidence that the design didn’t just meet expectations — it raised the bar for what chart-based trading could be, proving that a research-driven, user-focused approach really pays off.
Once the prototype was ready, we tested it internally with professional traders who trade daily — the ones for whom every second counts. Their reactions were immediate and enthusiastic: they could place trades, adjust positions, and monitor charts without losing focus, all in one view.
Feedback like “This feels like trading on autopilot, but with full control” reinforced that our approach wasn’t just functional — it was transformative for their workflow. This internal validation gave us confidence that the design didn’t just meet expectations — it raised the bar for what chart-based trading could be, proving that a research-driven, user-focused approach really pays off.

[ From insight to impact. ]
Impact in motion
Built for high-pressure moments, the experience brought clarity to fast-moving decisions—making execution feel seamless.
15%
Increase in adoption
~67K
Avg placed daily orders
~50K
Avg executed daily trades